Editor’s Note
This article is part of The Experience Center Operating Model, a series exploring what it actually takes to run a modern support experience center at scale, across people, automation, governance, and culture.
You will meet Jeff throughout this series. Jeff is a fictional character, but his situations are not. If he feels familiar, it is because most leaders pass through the same moments, face the same pressures, and make the same mistakes, often without realizing what is happening until the system pushes back.
If you arrived at this page by chance or through search, I recommend starting at the main series page to understand why this work exists and how the parts connect.
Jeff thought metrics would feel clean.
After staffing, onboarding, and nesting, he wanted something stable. Something objective. Something that would stop the endless debates about whether things were truly better or just temporarily quieter.
So he asked for dashboards.
And he got them.
A lot of them.
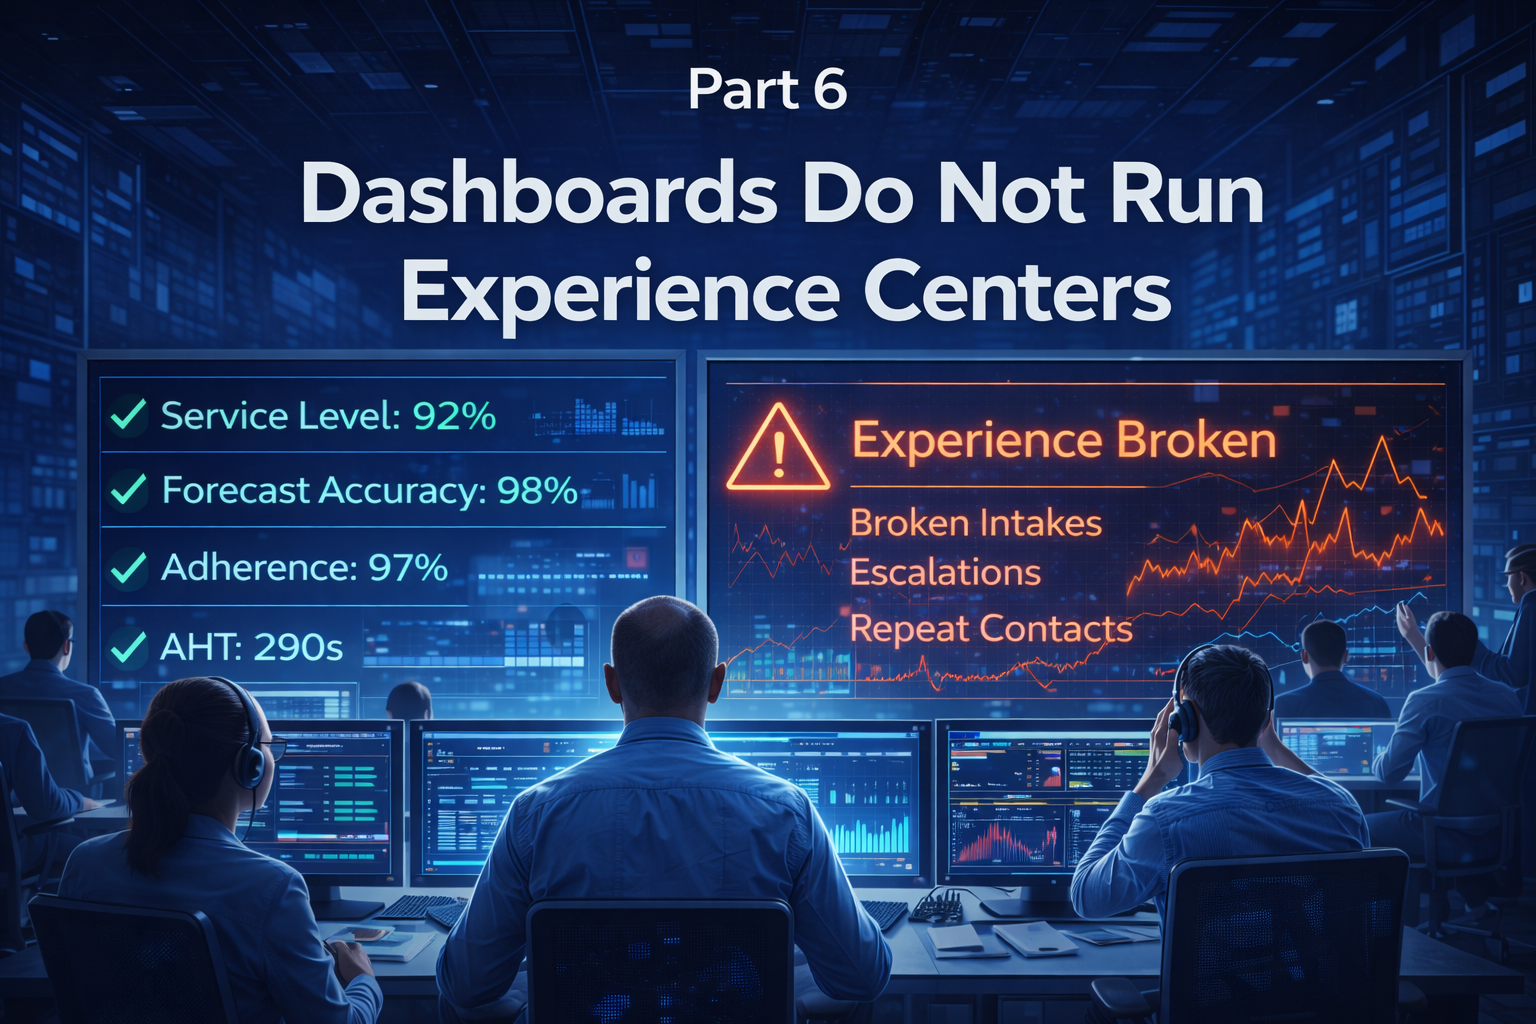
Service level charts. Handle time trends. CSAT summaries. Backlog counts. Productivity views. Leaderboards. Heat maps. A wall of green that looked like progress.
Then the experience center missed its targets anyway.
Not because people were not trying.
Because the numbers were not designed to drive action.
That was the sixth lesson Jeff learned about running a support experience center.
Dashboards do not create control. They create visibility. Those are not the same thing.
A Metric That Does Not Change Behavior Is Just Trivia
Most experience centers have plenty of metrics.
What they do not have is a metric system.
A system links signal to decision. It tells people what matters, what to do next, and what tradeoff is acceptable. It makes the right behavior easier, and the wrong behavior obvious.
Jeff looked at the dashboards again and realized the problem was not data.
It was relevance.
The metrics showed outcomes, but did not tell anyone what to do about them.
It was like staring at a speedometer after the accident.
Leadership Call Out
If a metric does not trigger a decision, it is not operational.
It is informational, and it will be ignored when pressure rises.
The Experience Center Was Being Managed by Lagging Indicators
CSAT was down. Escalations were up. Backlog was creeping.
Those were real signals, but they were late.
They told Jeff what the experience center had already become, not what it was becoming.
When a metric only tells you the result, it invites the worst leadership behavior.
Reaction.
Leaders chase the number. Managers push harder. Agents take shortcuts. The metric improves temporarily, and the system degrades underneath.
Jeff saw it clearly in the coaching conversations.
People were being coached to move numbers, not to improve behaviors.
Operational Reality Check
Lagging indicators are useful, but they are not steerable.
If you manage only outcomes, you force the organization to game them.
How Metrics Should Actually Be Chosen
Jeff made a mistake most leaders make at least once.
He asked, “What metrics should we track?”
Maria reframed the question immediately.
“Before that, we need to agree on what decisions we want to be able to make.”
That was the shift.
Metrics were not the starting point.
Decisions were.
The team stopped listing KPIs and started mapping moments. Where leaders intervened. Where managers coached. Where the system needed protection before customers felt pain.
Only then did metrics earn their place.
The rule was simple and unforgiving.
If a metric did not directly support a decision, it did not belong on the dashboard.
Leadership Call Out
Metrics should not describe performance.
They should enable intervention.
If no one can answer “what do we do when this moves,” the metric is noise.
The Action First Metrics Process
They formalized the process in four steps. Not as a framework deck. As an operating discipline.
Step 1: Name the Decision
What decision should this metric inform. Staffing adjustment. Coaching focus. Process change. Escalation. If the decision was unclear, the metric stopped there.
Step 2: Identify the Earliest Signal
What changes first when that decision becomes necessary. Not the outcome. The precursor. The behavior or flow signal that appears before customers feel it.
Step 3: Define the Threshold, Not the Target
Targets invite optimization. Thresholds enable action. The question was never “what is good,” but “when do we intervene.”
Step 4: Assign Ownership and Action
Who watches it. Who acts. What happens when it crosses the line. No owner meant no metric.
Nothing made it to the dashboard without surviving all four steps.
Operational Reality Check
A metric without a decision owner becomes a postmortem artifact.
A metric with a clear action path becomes a control lever.
One Dashboard, Five Audiences, Zero Alignment
Another issue surfaced immediately.
Everyone was looking at the same numbers, but they were using them for different reasons.
Executives wanted confidence the experience was stable.
Directors wanted to understand where risk was forming.
Managers wanted to know what to coach.
Agents wanted clarity on expectations.
WFM wanted to understand what was changing demand.
One dashboard could not serve all of that.
So it served none of it well.
Jeff watched the meeting play out the same way it always did.
Someone cited average handle time. Another person argued for customer effort. Someone else pointed to backlog. The room debated what mattered instead of deciding what to do.
It was not a metrics problem.
It was an operating model problem.
What Leaders Often Miss
A shared dashboard does not create alignment.
A shared decision model does.
The Metrics That Matter Are the Ones That Move First
Maria brought Jeff back to the same principle she used in forecasting.
Where does the system break first.
They stopped starting with outcomes. They started with drivers.
What happens before backlog grows. What changes before CSAT drops. What shows up before escalations spike.
They identified a small set of leading indicators tied to behavior and flow, not vanity.
Queue depth by interval, not daily totals.
Reopen rate, not closure count.
Transfer and recontact patterns, not handle time alone.
Schedule adherence exceptions tied to service impact, not policing.
Time to first meaningful response, not time to first touch.
Not because these were the only metrics.
Because these were the ones that moved early enough to intervene.
Leadership Call Out
Outcome metrics tell you if you won.
Leading indicators tell you if you are about to lose.
The Sixth Rule of Running a Support Experience Center
Dashboards do not run experience centers.
Decisions do.
The purpose of metrics is not to inform people.
It is to create a reliable loop. Signal to decision. Decision to action. Action to outcome.
Jeff stopped asking for more dashboards.
He asked for fewer metrics, clearer definitions, and explicit actions tied to thresholds.
If we see this, we do that.
If it trends here, we intervene here.
If it moves past this line, we escalate now, not later.
The result was not less data.
It was more control.
And once the experience center had control, Jeff could address the next reality.
Metrics only matter if people can act on them.
Which meant coaching.
Not as a meeting.
As a system.
When you are ready, we can move into Part 7, where Jeff learns the hard way that coaching is not about effort, it is about design, capacity, and repeatable behavior change.